
Financial Blog
A History of Interest Rates in One Chart
Kris Alban | Oct 16 2025 18:16
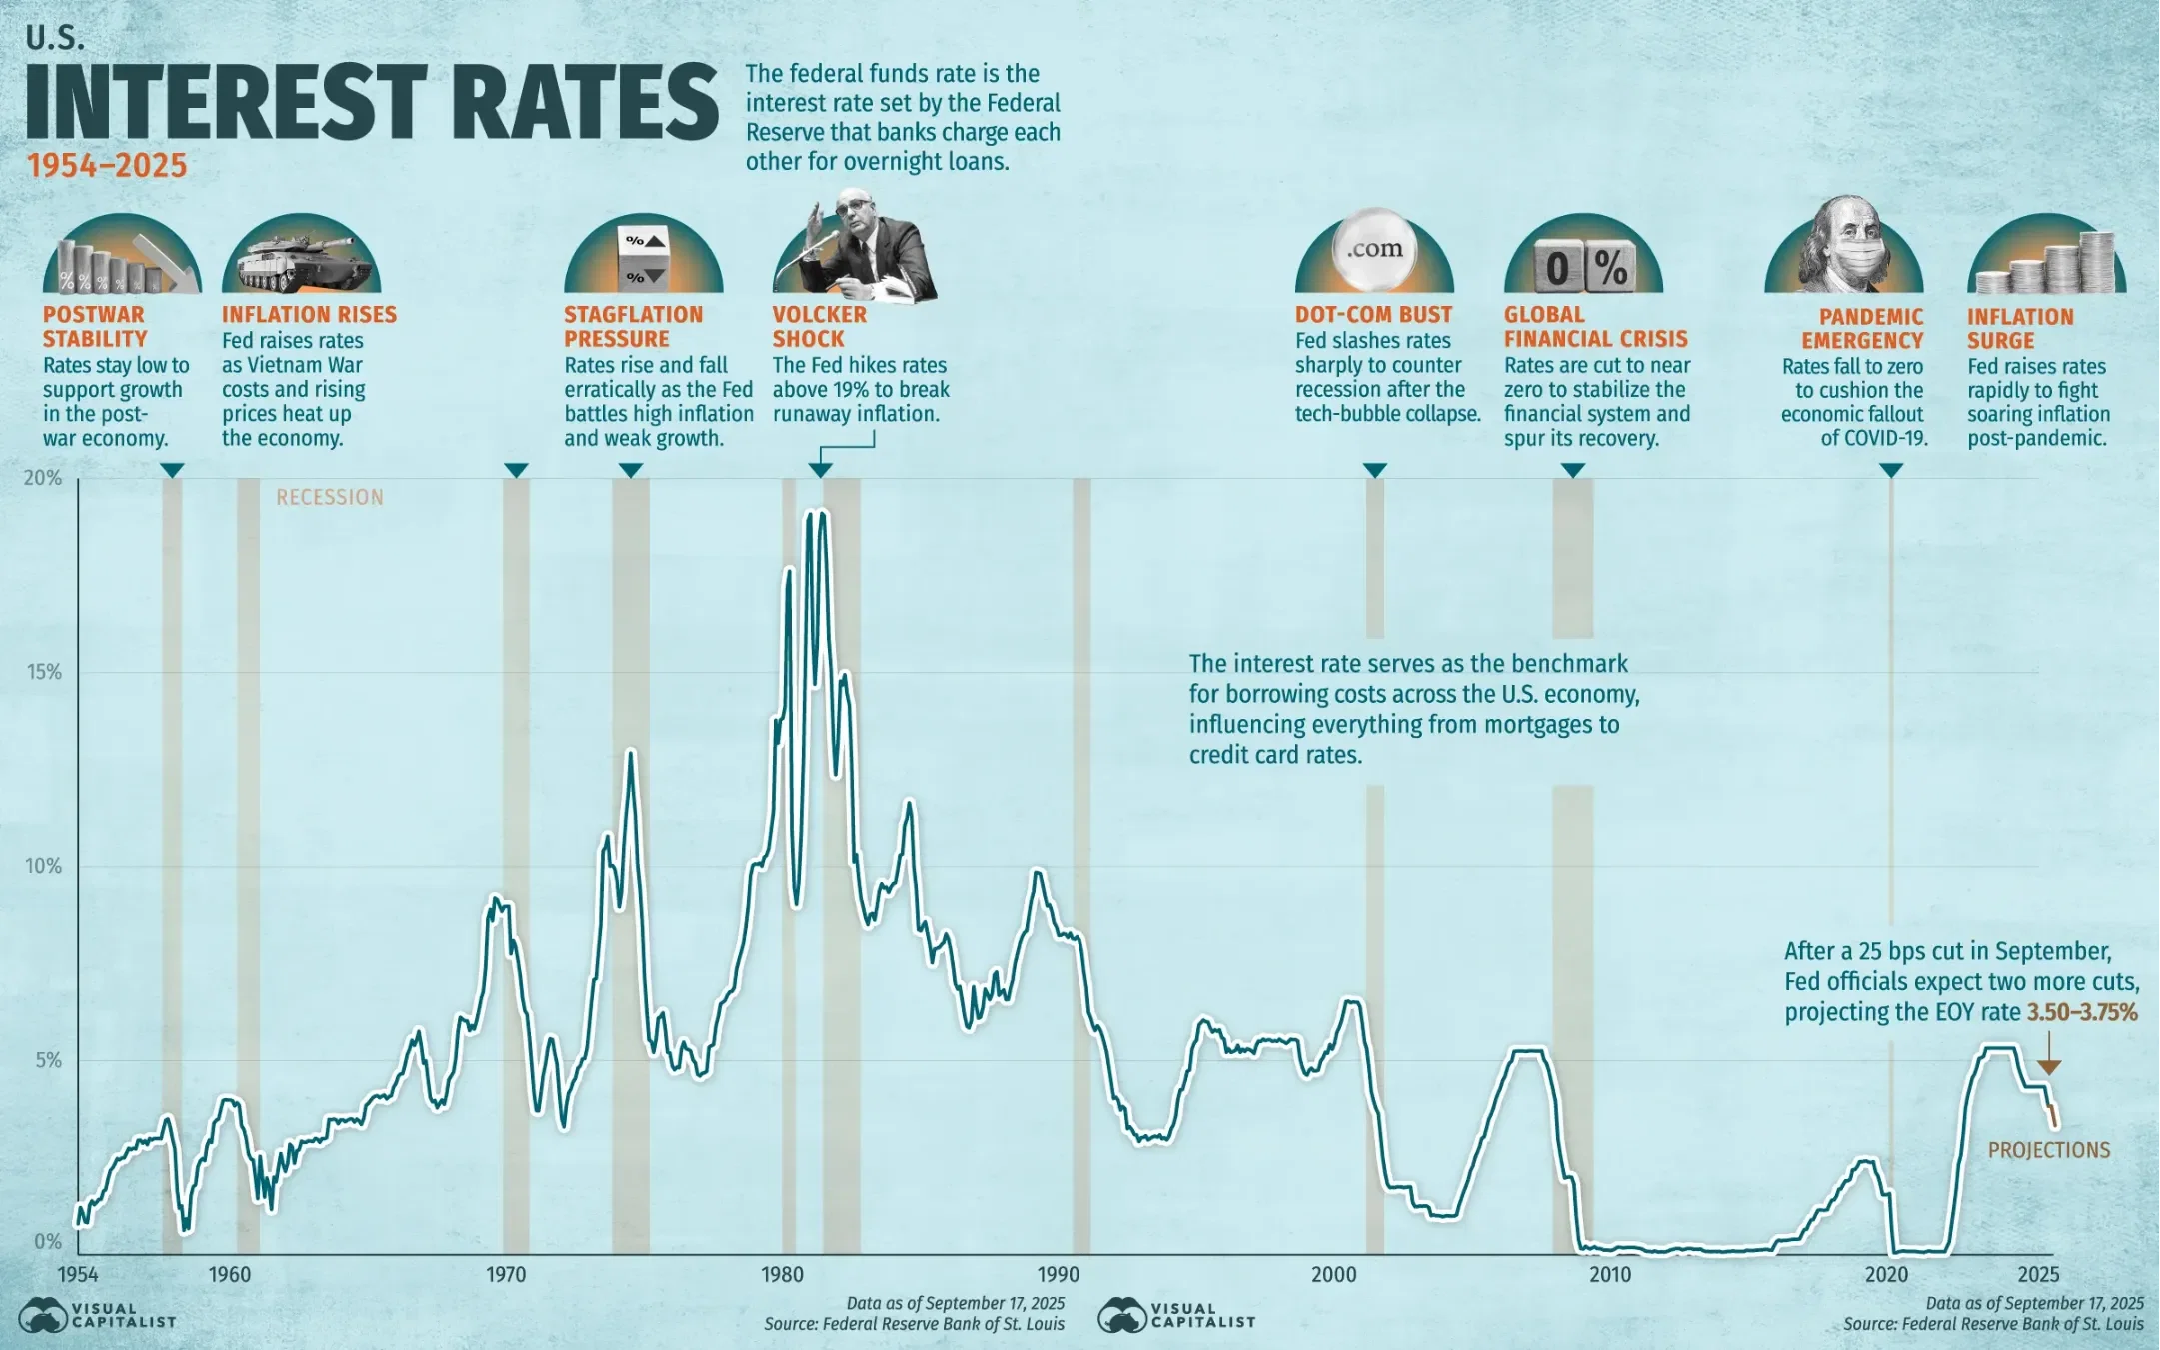
A Look at Interest Rates Over the Last 70 Years
Looking at this chart of historical interest rates is a bit like scrolling through old photos of your parents. You see them in the '80s, all big hair and shoulder pads, and the interest rates are up at 19%. Nineteen percent! That's the kind of rate that makes a payday lender blush. And then you get to the 2008 and 2020 photos, and the rates are basically on the floor, doing what looks like a very sad push-up.
What is Happening to Interest Rates Now?
But now, the rates are pulling themselves up off the ground, having recently started to ease back down a little. It's a reminder that nothing stays put for long, whether we're talking about '80s hairstyles or the Fed funds rate. It's all just another variable in the big equation of life – the part you can't control.
How Should This Impact Your Financial Plan?
The part you can control is having a plan that's ready for whatever the market decides to do next. It's not about predicting if rates will go up or down; it's about being prepared for either outcome. Because the one constant in all of this is that the only predictable thing is unpredictability. And that's something you can always build around.
To subscribe to the Charted Territory newsletter to get more charts and insights like this delivered to your inbox monthly, click here.
Click here to schedule a call.
From Morrisville to Main Street
Business in the Triangle moves fast, but your strategy should be built to last. Centrally located in Apex (Suite 230 on Hunter St) , we are the convenient choice for clients living in Cary or working in Morrisville . Stop by for a consultation that feels less like a transaction and more like a partnership.